NOPA
Nopa continues to outperform or match the city average, fueled by limited inventory and strong demand.
-
Who lives here?
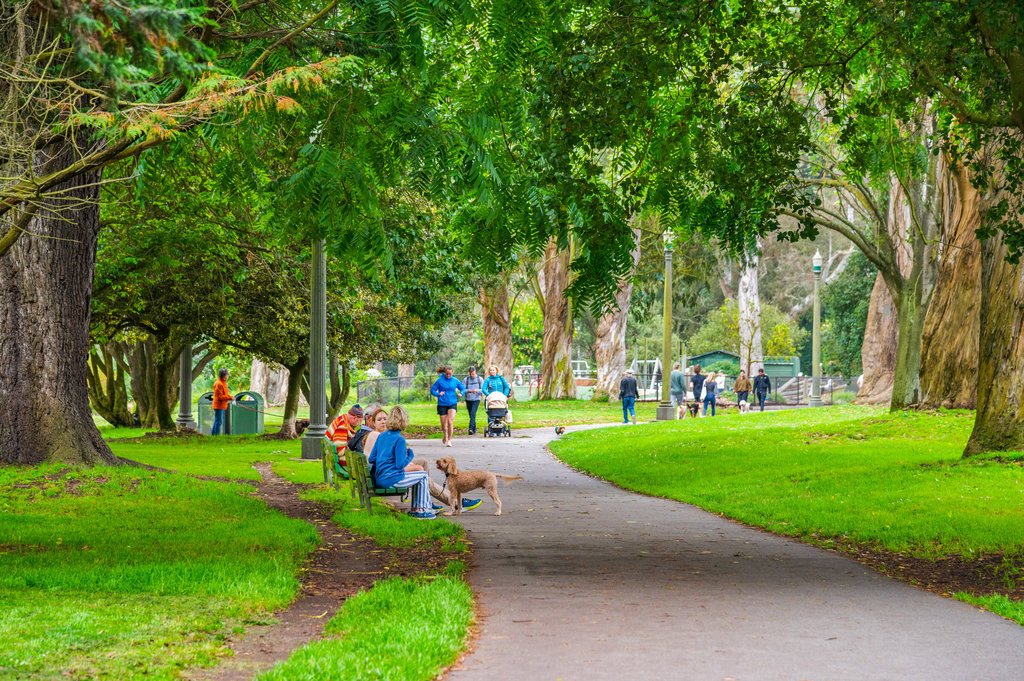
Long-time residents mingle with young professionals and families.
Nopa has a quiet neighborhood feel with easy urban access and an up-and-coming vibe.
11,192 people live in NoPa, where the median age is 36 and the average individual income is $86,247*.
Data provided by the U.S. Census Bureau.
-
Where do they live?
Mostly condos, in a mix of Edwardian, Victorian and mid-century buildings.
Nopa is a historic neighborhood much of the inventory was built no later than 1939.
.
Limited Inventory — High Demand
Continues into 2025
Unfortunately, we don’t have the inventory to satisfy the increase in demand, as we look to the Months of Supply Inventory (MSI) metric for context. The state of California has historically averaged around three months of MSI, so any area at or around three months of MSI is considered a balanced market. With just 1.1 months worth of single-family homes and 2.8 months worth of condos available for sale at this point in time, San Francisco has become a sellers’ market
New Listings
January
SF County - 919
District 6 - 51
Nopa - 9
February
SF County - 1,199 | +10.6%
District 6 - 73 | +5.8%
Nopa - 11 | -31.3%
Prices are holding steady
For properties that meet buyers’ needs, prices are holding steady. We are seeing multiple offers and overbidding back. There is a differential in Single Family Homes and Condos/ TICs as expected, especially in Nopa where SFH’s are limited
Average Sales Price
January
SF County - $1,673,935
District 6 - $1,368,427
Nopa - $1,662,341
February
SF County - $1,621,844 | -3.7%
District 6 - $1,340,034 | -0.5%
Nopa - $1,517,955 | +4.8%
Median Sales Price
January
SF County - $1,300,000
District 6 - $1,277,500
Nopa - $1,350,000
February
SF County - $1,300,000 | +0.9%
District 6 - $1,217,500 | +12.2%
Nopa - $1,220,000 | -8.2%